Employment Picture is Not Rosey For 2024
Monthly BLS data does not give the true picture of the IT and US employment picture
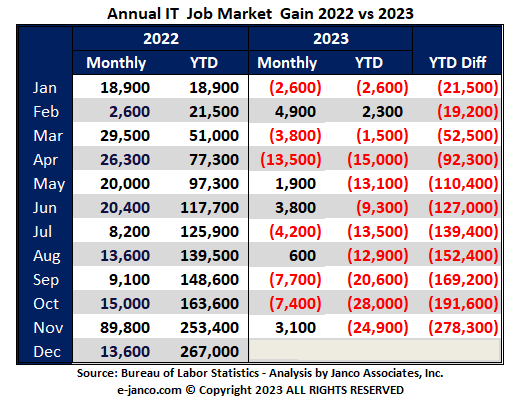
The IT job market grew by only 700 jobs in 2023 versus 267,000 in 2022. At the same time, the number of unfilled jobs in IT is now equal to the number of IT Pros who are unemployed.
Number of IT Jobs Created 2023 versus 2022
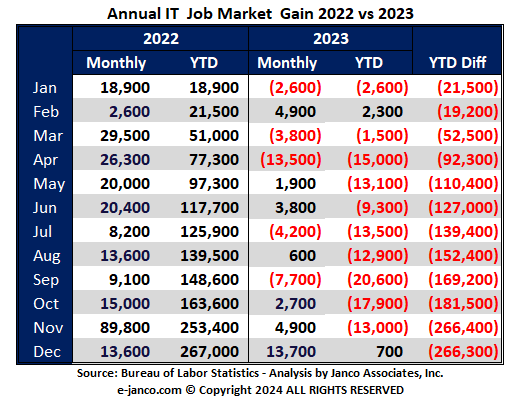
Granted November and December are preliminary numbers, they will change over the next two months as the BLS adjusts the data. In 2022, employers in the US hired back IT Pros at a record pace as they recovered from the pandemic. In 2023, the preliminary impact of AI was felt in many organizations as entry-level positions were automated.
For example, there has been the evolution of the help and support functions in IT and some enterprise operations. AI and web interfaces have taken the place of real people. In several organizations, we reviewed the number of FTEs (Full-Time Equivalents) in the help and support functions that were between 20 to 30 (including supervisors and managers) and now are between 4 to 5 FTEs. Driving this was the failure of outsourced and off-shore support options which did now meet management objectives.
Reasons why the employment picture is not as bright as reported by the BLS
We have identified eight reasons why the employment picture is not as good as reported in the national media.
-
In 2023 the second-largest growth market for jobs was the government. In December fully one-quarter of the jobs added were government. Even with that, the trend line number of jobs initially reported for the year is down. Add to that the push to reduce the federal deficit, and that trend may continue.
-
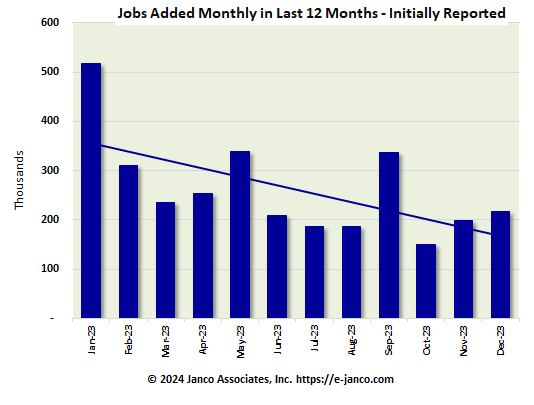
The BLS continues to reduce the number of new jobs created for prior months. Then when they report the number of jobs for the current month that data is inflated for the number of jobs added in the current month. For example, the number of US employment in December was reported as a 216,000 increase. October and November were revised down by 71,000 resulting in December’s data being 71K higher with those jobs accounted for in the prior month.
The two graphics below show the impact on the IT Job Market.
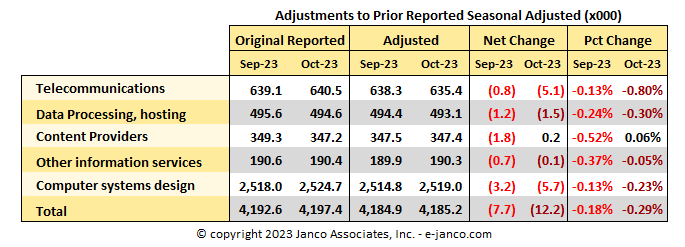
For the IT job market employment data, November showed an increase of 3,100 with the removal of 19,900 jobs in the prior two months. We have a historical analysis of this for the IT job market and see this is happening consistently.
-
The unemployment rate is based on the number of employees in the labor market. In December 2023 there were 709,000 more people than in December 2022. If those individuals were included the unemployment rate would have been higher.
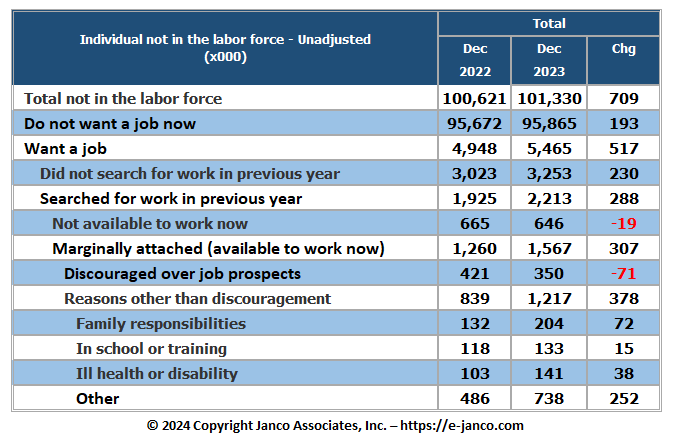
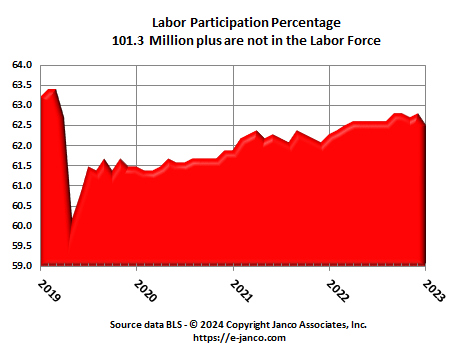
- The Labor Participation Rate has not recovered to the pre-pandemic levels. In December it fell 62.5% from 62.8% in November.
-
With Work at Home and part-time workers, more individuals have more than one job. For the total labor market, there are 8.6 million individuals who have a second or even third job. This is important because every additional job is counted as an additional person on the employment roles.
- In looking at employment numbers for native-born workers, that remain at pre-pandemic levers. Most of those individuals are typically “middle-class” workers. 130 million native-born workers were employed in December, about the same as it was in mid-2018. In 2023, employment among foreign-born workers increased by 1.3 million while employment among native-born workers rose by less than half that: just 625,000.
- AI is eliminating many entry-level positions as employers continue to control costs. AI, for many entry-level positions, is more cost-effective than outsourcing. Amazon, for example, has automated its distribution warehouses with robots, thus eliminating pickers.
- AI and machine learning are both on the move as some manufacturing jobs are coming back to the US. But this will not be a boon for many. For example, we reviewed one electric drill manufacturer that has brought its manufacturing back to the US. In China, there were 45 to 50 workers on the floor to manufacture the drill. They automated a factory in the US and currently have 15 to 20 workers with generation 1 of the automated factory. The manufacturer is now developing generation 2 of the factory and plans to have only 2 to 4 workers on the factory floor.
In summary, one month’s data is not a trend. Rather it is only an indicator of direction and has to be viewed in light of the entire labor market and the direction of the economy and technology that is being deployed.
Read on IT Hiring Kit Order IT Hiring Kit