Unemployment Rates by State - Low and High Unemployment Rate States
8 states have unemployment levels at 3% or less
On an ongoing basis, Janco analyzes the unemployment rates reported by the BLS. This is included in the firm's analysis of the projected number of jobs that will be added or deleted from the IT profession. The National unemployment data provides a measure of the health of the overall labor market. A more granular metric is one that considers local conditions - i.e. state and local unemployment.

The IT Unemployment rate in the past several months has exceeded the US national unemployment rate. This impact can be seen in both the computer hardware and software markets in falling sales. There currently are over 125,000 unemployed IT Professionals. Read on...
Subscribe to our Newsletter to get this information delivered to your inbox as soon as it is released. SUBSCRIBE
Long Term Trend - IT Job Market versus state by state unemployment rate
Employment of IT professionals traditionally is tied to the national unemployment rates. In our research we have found that the number of IT jobs created or lost is tied to the number of states that are at full employment (3.0% or less) versus those with high unemployment rates (5.0% or higher). In January there was one state Nevada 5.7% had the highest unemployment rate.
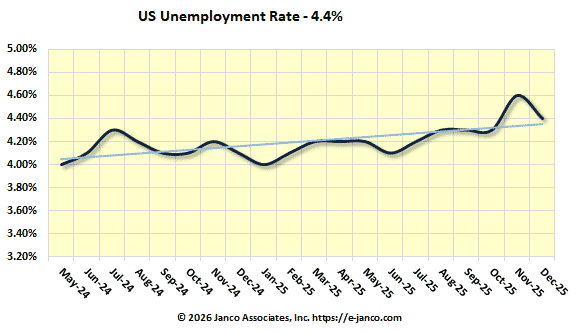
IT Unemployment Rate 7.0% versus a national unemployment rate at 4.4%
First signs of a poor employment picture are appearing in the IT job market - Demand still high for experienced CIOs and CTOs in large enterprises.
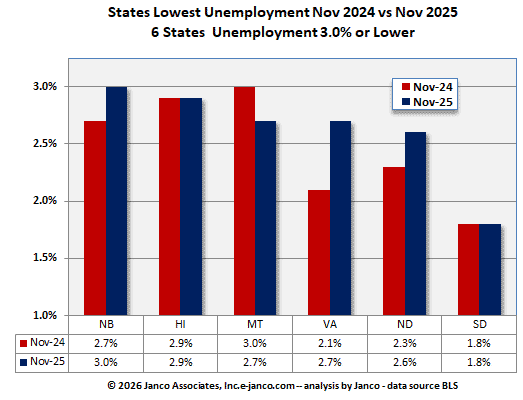
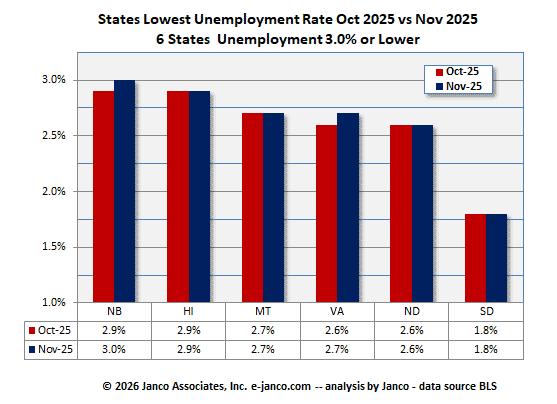
There are Six (6) Full Employment States
Latest data

High Unemployment States
The highest unemployment states are those that have an overall unemployment rate of 4.5% or higher. In August there were seven (7) states over 5% -- Delaware (6.0%), California (5.5%), Nevada (5.3%), Michigan (5.2%), Ohio (5.0%), and Oregon (5.o%). There were twelve (12) states that had an unemployment rate of over 4.5%. That is the same as the previous month.

Five (5) states with unemployment rates of 4.5% or above had unemployment rates that were worse than last year at this same time. Not a very good sign.

States with the Lowest Unemployment -- Full Employment States
At the start of the shutdown, there were 19 states with unemployment rates of less than 3.0%.
In September the number of full employment states was 6 states - That was a decrease of two states from eight last month
Latest data
All of the states that were at full employment levels have been there for 3 months with limited improvement. However, ten of these states had unemployment rates higher than the same same month last year.

In summary, the employment picture for IT Pros is mixed. Some growth can be expected, for selected skills.

