Top 20 cities for IT Pros
Which cities pay IT Pros the most?
Salaries for IT Pros continue to rise. Driving this is the increase dependence on IT technology, the size of the IT Job market and the shortage of qualified individuals to fill those open potions.
Top 20 Cities for IT Compensations
Historically the top locations for IT Professionals have been the Silicon Valley, Boston, the the Pacific Northwest (Seattle and Portland). That is changing for a number of reasons. Based on Janco's ccompensation database, the year to year increase in median salaries is depicted by the red line.
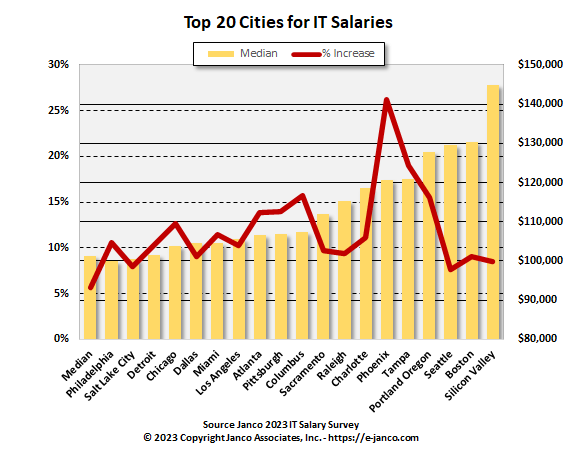
The cost of living in all of those locations is very high. In addition the charged political environment are make those, especially the Pacific Coast, places that not looked on favorably to raise families. Give that the exhibit above and the table below show the median compensation for IT Professionals and the rate of increase in that median this past year.
| Median | % Inccrease | |
| Janco Median | $ 101,323 | 5.61% |
| Philadelphia | $ 99,890 | 10.6% |
| Salt Lake City | $ 100,475 | 8.0% |
| Detroit | $ 101,483 | 10.3% |
| Chicago | $ 103,779 | 12.6% |
| Dallas | $ 104,477 | 9.0% |
| Miami | $ 104,542 | 11.4% |
| Los Angeles | $ 105,466 | 10.2% |
| Atlanta | $ 106,489 | 13.9% |
| Pittsburgh | $ 106,789 | 14.0% |
| Columbus | $ 107,413 | 15.7% |
| Sacramento | $ 111,961 | 9.7% |
| Raleigh | $ 115,204 | 9.4% |
| Charlotte | $ 118,465 | 11.1% |
| Phoenix | $ 120,731 | 26.2% |
| Tampa | $ 120,900 | 19.0% |
| Portland Oregon | $ 127,734 | 15.5% |
| Seattle | $ 129,456 | 7.6% |
| Boston | $ 130,399 | 9.0% |
| Silicon Valley | $ 144,962 | 8.5% |
Statistics Presented by City
The IT salary survey presents the numerical results in a tabular fashion. Shown are the normalized minimum and maximum for the base salary, as well as the total compensation (including supplemental compensation) for each position, as well as Janco’s own benchmark. The remaining columns show figures for 78 typical United States metro areas, as well as 24 selected metro areas in Canada, with adjustments made on the basis of such factors as cost of living, local economic indicators, and regional industry forecasts. City data includes perks. US cities data is in US dollars and Canadian cities data is in Canadian Dollars.
The Compensation Study data is divided into two categories. Large companies are companies whose gross revenues are equal to or greater than $500 MM or more than 1,000 total employees. Mid-sized companies are companies whose gross revenues are less than $500 MM and less than 1,000 employees
All salaries are normalized to a national standard, taking into account the cost of living in the metropolitan areas presented. Note some metro areas may not have sufficient data points to be statistically accurate to plus or minus 5%. However, all of the national numbers are statistically valid for plus or minus 1.2%
Read on Salary Survey Order Salary Survey Download Summary